User Interface Manual
Revision: 2.9
Copyright © 2003-2022 Smart Avionics Ltd.
17/06/2022
- 1. Introduction
- 2. Polar Tab - Propeller Balancing
- 3. Polar Tab - Rotor Balancing
- 4. Spectrum Tab
- 5. Data Tab
- 6. Options Page
- 7. Propeller Balancing
- 8. Rotor Balancing
- 9. Two Plane Balancing
- A. PB-4 Configuration Values
- B. User Interface Configuration
- Index
- 1.1. Initial screen
- 2.1. Polar tab - propeller balancing (with options visible)
- 2.2. Polar chart - propeller balancing
- 2.3. Points List Header - Propeller Mode
- 2.4. Set Weight Amounts And Positions Dialog
- 2.5. Point details dialog - propeller mode
- 2.6. Weight site spider
- 3.1. Polar tab - rotor balancing (with options visible)
- 3.2. Polar chart - rotor balancing
- 3.3. Points List Header - Rotor Mode
- 3.4. Span Adjustment Dialog
- 3.5. Add Move Line Menu
- 3.6. Standard accelerometer orientation (top view)
- 3.7. Point details dialog - rotor mode
- 3.8. Rotor balance solution dialog
- 3.9. Edit move line dialog
- 3.10. Span Adjustment Settings
- 4.1. Spectrum tab (with options visible)
- 4.2. Rotor spectrum with line info box
- 5.1. Data tab (with options visible)
- 6.1. Options page (when connected to PB-4)
- 6.2. Accelerometer orientation during calibration
- 7.1. Sine wave
- 8.1. Rotor spectrum with large × 2 peak
- 8.2. Rotor Adjustments
- 9.1. Two plane balancing an object supported at both ends
- 9.2. Two plane balancing an overhung object
- 9.3. Two plane balancing dialog
- B.1. UI configuration dialog
- B.2. Example profile configuration
This manual describes the PB-4's browser based user interface and how to use it to balance a propeller or rotor. Please refer to the PB-4 Hardware Manual (pb4_hw_manual.pdf) for information regarding the PB-4 hardware and how it is installed prior to carrying out a balancing job.
For simplicity, this manual refers to the user interface as a tablet but it could be any device that supports a modern web browser and it talks about “clicking” buttons. Obviously, if the device has a touch screen then you will be “touching” or “tapping” rather than clicking.
This manual describes the PB-4 user interface software version 2 upwards.
![[Note]](images/note.svg) | |
In depth tutorials that cover propeller and rotor balancing using the PB-4 are available on the Smart Avionics website. |
Safari users please note that the PB-4 is not compatible with Safari's “Private Mode”.
Accessing the PB-4 user interface from your tablet's browser requires the PB-4 and the tablet to be using the same Wi-Fi network.
When the PB-4 is in AP mode, the Wi-Fi network name (SSID) will be PB4-XX where XX are two letters/digits. You will need to tell your tablet to use that Wi-Fi network (via its Wi-Fi configuration). At the airfield, the tablet will probably use the PB-4 Wi-Fi automatically because your normal Wi-Fi is not available. If not, you will have to tell the tablet to use the PB-4 Wi-Fi manually.
Once the tablet is using the PB-4 network, you can load the user interface page into the browser. If your tablet supports MDNS, you can simply use pb4.local as the host name in the browser. Apple devices (mac/ipad/iphone) and most Linux systems have MDNS, most Windows systems do not. If not, use the IP address 172.21.21.1. Having accessed the PB-4 user interface page, just add a bookmark for that page in your browser called something like "PB-4 AP Mode (at the airfield)".
When the PB-4 is in STA mode, the Wi-Fi network name (SSID) will be whatever you normally use at the current location. The PB-4 will need to be taught that SSID and the associated password. The PB-4 supports WPS for automatically obtaining the SSID and password from the access point which is quick and easy if the access point also supports this feature. Alternatively, you can manually enter the credentials by starting the PB-4 in AP mode, loading the user interface into your browser (as described above), connecting to the PB-4 (click on red button) and then going to Menu / Options / PB-4 Configuration / Set Access Point Details.
Once the PB-4 is able to connect to the local network, you can load the user interface page into the tablet's browser. Again, if MDNS is supported by the tablet, the host name pb4.local can be used. Otherwise, you need to find out the IP address that has been assigned to the PB-4 by the access point. Follow these steps:
Turn on the PB-4 in STA mode (press the on/off switch until LED 2 goes green). When you release the switch, LED 2 will go off and then after a few seconds will flash green slowly if the PB-4 has successfully managed to log into the access point.
Turn the PB-4 off (press switch until the LEDs go out).
Turn the PB-4 on again but this time start it in AP mode (press on/off only until LED 1 comes on).
Access the PB-4 user interface page with your browser as described in the previous section, connect to the PB-4 (click on red button) and then go to Menu / About. The about box will contain a line that says STA Mode IP Address: XX.XX.XX.XX. The address that is shown is the IP address that has been assigned to the PB-4 by the access point, note it down.
Having found out the PB-4's IP address when in STA mode, you can use that address to access the user interface page and then add a bookmark for that page in your browser called something like "PB-4 STA Mode (at home)".
When you load the PB-4 user interface into your browser, after showing the splash screen for a few seconds it will show an initial screen, like Figure 1.1, “Initial screen”
This shows a polar chart and a list of captured points (both empty as no points have been captured yet). At the top of the screen, are the Menu and Connect buttons and the name of the current job.
Most of the screen is used to display the PB-4 data. At the top of the region are three tabs (Polar, Spectrum & Data) which you use to select the data you wish to see.
| Polar | The polar tab shows a polar chart, a list of captured points and some buttons. For a detailed description of using the polar tab see Chapter 2, Polar Tab - Propeller Balancing (propeller balancing) and Chapter 3, Polar Tab - Rotor Balancing (rotor balancing). |
| Spectrum | The spectrum tab shows a spectral display, a list of captured spectra, a list of spectral lines and some buttons. See Chapter 4, Spectrum Tab for a detailed description of the spectrum tab. |
| Data | The data tab shows an area that displays the current vibration data (RPM, IPS, DEG) as text and some buttons. See Chapter 5, Data Tab for a detailed description of the data tab. |

The PB-4 user interface is "responsive" - the layout changes depending on the resolution and orientation of the user interface's screen. It should be usable on many different user interface devices. For in-cockpit use, a 7" form factor tablet is ideal. For lower resolution devices, you may find that changing the orientation to landscape is beneficial.
The PB-4 supports the notion of a "job".
A job is simply a named collection of data (points and spectra) associated with a single balancing job.
There is always a current job. The name of the current job is displayed alongside the connect button. When data is captured, it will be stored in the current job.
Each job is named and may be loaded into the user interface to become the current job. The points and spectra captured for that job can then be viewed.
Jobs can be created, deleted and renamed.
The default job is always available. If you delete it, it is recreated.
All of the job data is stored on an SD card in the PB-4.
Jobs can be exported and imported so you can share job data with other PB-4 operators and also view the job using the PB-4 online viewer.
Clicking the menu button pops up a menu with these items:
- Options
Clicking this will toggle the visibility of the options page. When the options page is being displayed, to return to the tabs page you can either click Menu / Options again or press the browser's back button.
- Two Plane Balancing
Opens the two plane balancing dialog.
- Fullscreen
If your browser supports displaying a web page fullscreen, clicking this will toggle fullscreen mode. To exit fullscreen mode, either click Menu / Fullscreen again or press the
Esckey (if your device has a keyboard!)- Help
Clicking this will display a simple web page with links to the PB-4 documentation.
- About
Clicking this will display the About dialog. Some of the information in the dialog is only available when the PB-4 is connected.
The connect button toggles the user interface - PB-4 connection state. The current state is indicated by the colour of the button:
| red | When the button is red, the user interface is not connected to the PB-4. The browser can display the data for the current job that has already been captured but no new data can be displayed or another job viewed until the connection has been made to the PB-4. |
green | When the button is green, the user interface is connected to the PB-4 and the text on the button is updated with the PB-4's battery capacity remaining[a]. New data can be displayed and other jobs can be accessed via the options page. |
orange | The button is orange while the connection to the PB-4 is being established and also when the battery is down to the last 20-30 minutes of run time to remind you that you will need to change the batteries soon[b]. |
[a] The battery capacity remaining is estimated from the time the PB-4 has been running since the batteries were last changed. It assumes the batteries were fully charged to their rated capacity when they were installed. [b] This low battery warning is based on the battery voltage and is an accurate indication that the batteries are almost flat. | |
If the browser page is reloaded from the PB-4 while connected or the browser is closed, the connection will be dropped.
The PB-4 will turn itself off automatically after 30 minutes of not being connected.
The polar tab shows the polar chart we use when balancing. Some features of this tab differ depending on whether we are balancing a propeller or a rotor. Here we see the polar tab displaying the results of a propeller balancing job.
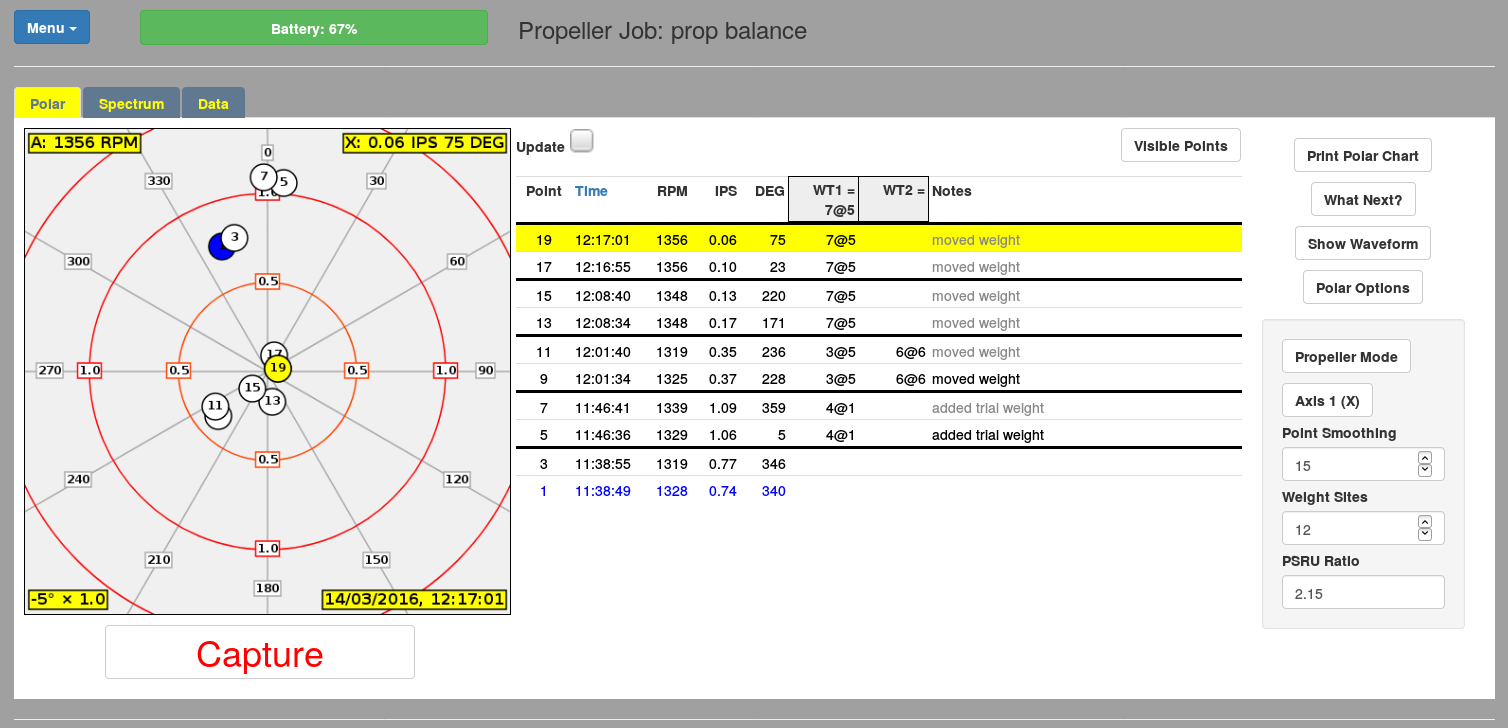
The polar chart shows the points that were captured during the balancing process. The chart may be panned and zoomed[1]. If the PB-4 is connected and the Update checkbox is checked, the chart will be updated in real-time to show the current balance condition.
The current point is simply the most recent point sent from the PB-4 when the display is being updated in real-time or the point that has been selected in the points list when the display is not being updated in real-time.
Each point is plotted as a circle[2], the colour coding of the plotted points are:
| White | Captured point. |
| Blue | Start point. |
| Yellow | The current point. |

The chart shows some text in yellow boxes that describes the current point:
The top-left box contains the tacho channel name (A or B) and the current point's propeller RPM.
The top-right box contains the accelerometer channel name (X, Y, X2 or Y2) and the current point's IPS and DEG values.
The bottom-right box contains the date & time the current point was measured.
The bottom-left box is only visible if there is a start point defined for the axis. It shows a “solution”, i.e. what adjustment needs to be made to the balance weight to improve the balance. The adjustment has the form ANGLE × SCALE. ANGLE is signed; a positive value means move the weight forward (in the direction of propeller rotation) that many degrees and a negative value means move the weight backward (opposite to the direction of propeller rotation). SCALE is a multiplier that specifies the required change in weight; e.g. a value of 1.2 means increase the weight by 20%, a value of 0.5 means halve the weight. So in the chart above, the solution is saying move the weight backwards 5° and keep the amount the same.
To the right of the polar chart are the Update check box, the points visibility menu and the points list.
The Update checkbox controls whether the polar chart is automatically updated to show the latest polar point(s) returned by the PB-4 when it is connected. If not checked, the last displayed data is preserved. So if you want to pause the display, un-check this checkbox.
The points visibility menu controls which points are displayed in the points list and the polar chart. The choices are:
- All
All points will be displayed. Also, the point index number column is highlighted and clicking on a point's index number will toggle its hidden state.
- Visible
All points that have not been hidden will be displayed.
- Best
Only the “best” point from each group of points is displayed. The points are grouped by similar capture time and RPM. If there are less than 3 points in the group, the point with the lowest IPS value is considered to be the best. When a group contains 3 or more points, the best point is the point that is closest to the average position of all the points in the group.
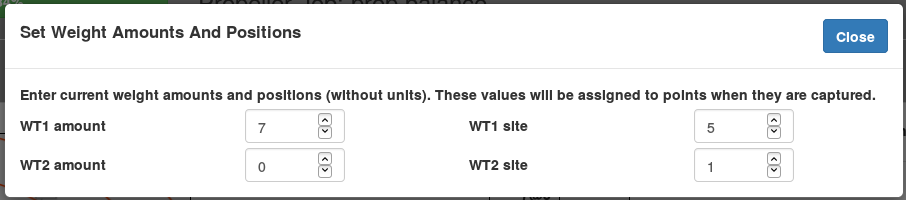
The points list header row contains two column headers (WT1 and WT2) that show the current weight configuration.
The weight configuration values have the form AMOUNT @ SITE where AMOUNT is a number ≥ 0 and SITE is a value from 1 to the number of weight sites being used for the current job (see later). Clicking on those values opens the Set Weight Amounts And Positions dialog. In there are input fields into which you enter the current weight configuration as separate numbers. The weight amounts and positions you specify will be assigned to the polar points that are subsequently captured. The weight amounts can be in conventional weight units (e.g. grams or ounces!) or simply numbers of washers.
The points list contains one row for each point that has been captured. The points are listed in reverse capture order, the most recently captured point being at the top of the list. Clicking on the Time header reverses the order of the list.
Each row in the list shows the data for a single point (time of capture, RPM, IPS, DEG, the amounts and locations of the balance weights that were present when that point was captured and the point's notes).
Groups of points with similar capture times and RPM values are separated by a black line.
Clicking on a row will make the selected point the current point and it will be displayed with a yellow background. Clicking that row again will display the point details dialog for the selected point.

To the right of the points list are a drop down menu and some buttons:
This gives you the choice of either printing just the chart or the chart and a table of points. It will create a new page in your browser which you can then print using the normal browser print page facility (e.g. type Ctrl-P).
Clicking this will open a dialog that suggests your next action. When you are doing your first propeller balances, you may find this useful.
Clicking this will toggle the display of the polar options box, the options in the box are:
The Propeller/Rotor Mode button pops up a menu that let's you choose the polar mode for the current job.
Drop down menu, Axis 1 lets you choose the axis to be displayed in the points list and polar chart.
The Point Smoothing text input box is used to specify the number of readings that are averaged together to produce a single polar point. A low value will allow more variation in the polar points and the display will react more quickly to input changes (i.e. changes of RPM). A large value will tend to smooth out variations in the polar points but will make the display slower to react to input changes so you will need to wait longer for the point to settle in the averaged position. The value should be between 1 and 50, the default is 15.
The Weight Sites text input box is used to specify the number of locations that balance weights may be attached to. For a typical propeller balancing job, this would be the number of fasteners that hold the spinner to its backplate. It cannot be less than 3.
The PSRU Ratio text input box is used to enter the ratio of the engine to propeller step down gearbox. If your engine has a PSRU and you know the ratio, enter it here as a single number (i.e 2.43 rather than 2.43:1). If you don't know the ratio or the engine doesn't have a PSRU, enter 1. When applicable, using a value other than 1 allows the software to calculate the engine RPM from the propeller RPM and this information can be used to help identify the source of peaks that may occur in the spectral display.
This dialog displays the detailed information for the selected point along with some text input boxes and buttons as shown in Figure 2.5, “Point details dialog - propeller mode”. To open this dialog simply click the selected point's row in the point list a second time. The buttons are:
The Hide This Point button will make the current point “invisible”, i.e. it will not be displayed in the points list or shown on the polar chart unless the point visibility menu is set to All. When a point has been hidden, this button becomes the Show This Point button and clicking on it will make the point visible again.
The Use As Start Point button designates the current point to be the start point. A start point is simply a point that was captured before any balance weights were attached, it represents the propeller balance starting condition. Once a point has been chosen as the start point, the button becomes the Don't Use As Start Point button and clicking on it makes the current point no longer to be considered the start point.
If the point was captured with acceleration data (see the With Waveform Data option in Chapter 5, Data Tab), the Show/Hide Waveform button will be visible and clicking that will toggle the display of the waveform.
If a spectrum was captured within 10 seconds of the point being captured, the Show/Hide Matching Spectrum button will be visible and clicking on that will toggle the display of the matching spectrum.

The text input boxes are:
The Notes text input box is used to enter any notes that you wish to record for the point.
Two rows contain text input boxes that are used to alter the amount and location (site number) of the balance weights that were present when this point was captured.
The weight configuration should be set before the points are captured by clicking in the WT1 or WT2 columns of the polar point list header as described in Section 2, “Points list”. If that is done, the weight configuration is copied into points as they are captured. However, if you forget to enter that information before capturing the points or you need to change the values for some reason then this information can be edited in the point details dialog.
Below the weight configuration are instructions as to how the current weight configuration should be changed to improve the balance. The new weight amounts displayed are shown rounded to the nearest integer and also as (more) exact values.
The Set Configuration To This Solution and Set Configuration To Exact Solution buttons are a convenient way of updating the current configuration to the recommended values. They just save you some clicking and typing, you still have to make the actual changes to the weight configuration on the aircraft!
The polar chart can optionally display a "spider" that may help the operator visualise where the balance weights need to be added. The spider's body is the start point and it has one leg for each weight site. The legs are numbered to match the weight sites and their orientation is derived from the polar points that have previously been captured for this job.
The idea is that just by looking at where the middle of the chart falls between the spider's legs you can see where the weight needs to be positioned. In the example below, leg 5 crosses the middle of the chart so the weight needs to be located at site 5.

The spider is displayed after the start point has been set and at least one other point has been captured that has weight assigned to a site. To enable the spider, open the UI configuration dialog and in the Polar Chart section there is an option to set the prop mode weight site lines colour. Enter a colour, i.e. blue, save the configuration and reload the page.
The polar tab shows the polar chart we use when balancing. Some features of this tab differ depending on whether we are balancing a propeller or a rotor. Here we see the polar tab displaying the results of a rotor balancing job.

The polar chart shows the points that were captured during the balancing process. The chart may be panned and zoomed[3]. If the PB-4 is connected and the Update checkbox is checked, the chart will be updated in real-time to show the current balance condition.
The chart may show move lines (the red, green and blue lines in the above figure).
The current point is simply the most recent point sent from the PB-4 when the display is being updated in real-time or the point that has been selected in the points list when the display is not being updated in real-time.
Each point is plotted as a circle[4], the colour coding of the plotted points are:
| White | Point captured from axis 1. |
| Grey | Point captured from axis 2. |
| Yellow | The current axis 1 point. |
| Gold | The current axis 2 point. |
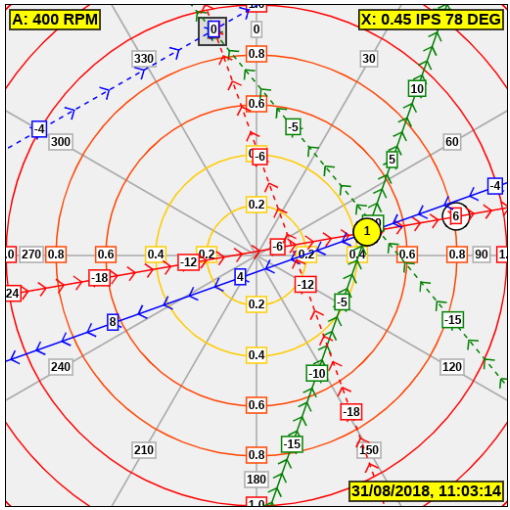
The chart shows some text in yellow (or gold) boxes that describes the current point:
The top-left box contains the tacho channel name (A or B) and the current point's rotor RPM.
The top-right box contains the accelerometer channel name (X, Y, X2 or Y2) and the current point's IPS and DEG values.
The bottom-right box contains the date & time the current point was measured.
To the right of the polar chart are the Update check box, the point visibility menu and the points list.
The Update checkbox controls whether the polar chart is automatically updated to show the latest polar point(s) returned by the PB-4 when it is connected. If not checked, the last displayed data is preserved. So if you want to pause the display, un-check this checkbox.
The points visibility menu controls which points are displayed in the points list and the polar chart. The choices are:
- All
All points will be displayed. Also, the point index number column is highlighted and clicking on a point's index number will toggle its hidden state.
- Visible
All points that have not been hidden will be displayed.
- Best
Only the “best” point from each group of points is displayed. The points are grouped by similar capture time and RPM. If there are less than 3 points in the group, the point with the lowest IPS value is considered to be the best. When a group contains 3 or more points, the best point is the point that is closest to the average position of all the points in the group.
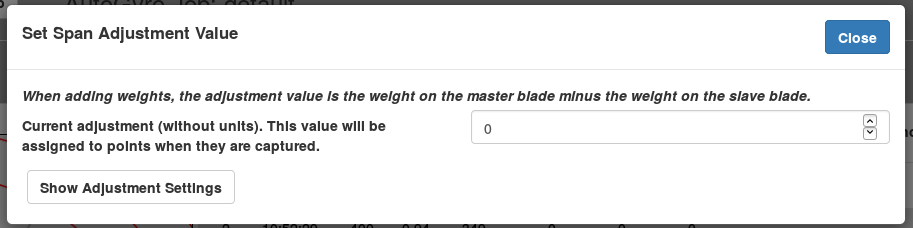
The points list header row contains three adjustment columns, Span, Chord and Pitch.
Clicking on one of those adjustment columns will open a dialog that allows you to change the current value of the adjustment.
The current adjustment values are assigned to polar points when they are captured. Clicking Show Adjustment Settings expands the dialog to show you fields that characterise the adjustment. The settings are described in Changing Adjustment Settings.
The points list contains one row for each point that has been captured. The points are listed in reverse capture order, the most recently captured point being at the top of the list. Clicking on the Time header reverses the order of the list.
Each row in the list shows the data for a single point (time of capture, RPM, IPS, DEG, adjustment values and the point's notes). The rows that correspond to axis 1 have a white background and the rows that correspond to axis 2 have a grey background.
Groups of points with similar capture times and RPM values are separated by a black line.
Clicking on a row will make the selected point the current point and it will be displayed with a yellow (axis 1) or gold (axis 2) background. Clicking that row again will display the point details dialog for the selected point.

To the right of the points list are a drop down menu and some buttons:
This gives you the choice of either printing just the chart or the chart and a table of points. It will create a new page in your browser which you can then print using the normal browser print page facility (e.g. type Ctrl-P).
Clicking this will open a dialog that suggests your next action. When you are doing your first rotor balances, you may find this useful.
Clicking this will toggle the display of the polar options box, the options in the box are:
The Propeller/Rotor Mode button pops up a menu that let's you choose the polar mode for the current job.
Drop down menus, Axis 1 and Axis 2 let you choose the axes to be displayed in the points list and polar chart.
The Point Smoothing text input box is used to specify the number of readings that are averaged together to produce a single polar point. A low value will allow more variation in the polar points and the display will react more quickly to input changes (i.e. changes of RPM). A large value will tend to smooth out variations in the polar points but will make the display slower to react to input changes so you will need to wait longer for the point to settle in the averaged position. The value should be between 1 and 50, the default is 15.
The Show Move Lines checkbox enables the display of all the defined move lines. The visibility of an individual move line can also be set from the edit move line dialog.
The Add Move Line button pops up a menu of possible move lines. Select one of the predefined move line names and the edit move line dialog will open to allow you to enter the move line's parameters. Before you create any move lines, make sure that the right profile is selected (see below) so that the polar points are positioned correctly on the chart as you will be using their positions to define the move line.
The Edit Move Line button pops up a menu of the existing move lines defined for the currently displayed axes. Select the move line you wish to edit and the edit move line dialog will open.
The Load Move Lines button pops up a dialog which lists the known jobs. Selecting a job will, after confirming the action, load the move lines from that job into the current job. The move lines loaded will overwrite any existing move lines in the current job with the same name so if you wish to preserve the existing move lines, rename them first.
The Profile button pops up a menu of known profiles so that you can select the profile for the job.

A profile configures the user interface for a particular type of aircraft or scenario. Each profile specifies a few values that can modify how jobs are displayed. Profiles can currently contain these values:
- sensorOffsets
An array of four values that specify the angle offsets (rotations) of the accelerometer axes (X, Y, X2, Y2) from the datum position. The datum position is normally taken to be when the master blade is pointing forward. Having a non-zero angle offset for an axis will rotate the polar points for that axis around the centre of the chart in a clockwise direction.
- tachoOffset
The angle the rotor sweeps through between the rotor position when the tacho triggers and the rotor position when the master blade is in the datum position. If the tacho and the tape are aligned when the master blade is in the datum position, this angle will be 0. Having a non-zero tacho offset will rotate all the points around the centre of the chart in an anti-clockwise direction.
If a second accelerometer is mounted near the front of the machine, it is expected to be orientated such that its X axis is pointing to the right and its Y axis is pointing vertically upwards.
The following table lists the supplied profiles. The user can also define their own profiles (see Appendix B, User Interface Configuration).
| Profile Name | Description | sensorOffsets | tachoOffset |
|---|---|---|---|
| None | A profile that doesn't have any effect. | [0, 0, 0, 0] | 0 |
| Standard, AutoGyro, ELA, Magni | These profiles are currently all identical. They all set sensorOffsets so that the X and X2 polar points rotate 90° clockwise on the chart. This is applicable when the accelerometer mounted on the mast is orientated such that its X axis is pointing horizontally to the right and the Y axis is pointing horizontally forward. This is the standard accelerometer orientation recommended by Smart Avionics as depicted below. The tachoOffset value is zero so it is expected that the tacho triggers when the master blade is in the datum position. | [90, 0, 90, 0] | 0 |

This dialog shows the detailed information for the selected point along with some text input boxes and buttons as shown in Figure 3.7, “Point details dialog - rotor mode”. To open this dialog simply click the selected point's row in the point list a second time. The buttons are:
The Hide This Point button will make the current point “invisible”, i.e. it will not be displayed in the points list or shown on the polar chart unless the point visibility menu is set to All. When a point has been hidden, this button becomes the Show This Point button and clicking on it will make the point visible again.
If the point was captured with acceleration data (see the With Waveform Data option in Chapter 5, Data Tab), the Show/Hide Waveform button will be visible and clicking that will toggle the display of the waveform.
If a spectrum was captured within 10 seconds of the point being captured, the Show/Hide Matching Spectrum button will be visible and clicking on that will toggle the display of the matching spectrum.
If adjustment values and move lines have been defined, the Calculate Balance Solution button will be visible. This button opens the rotor balance solution dialog that displays the calculated solution for the current point.
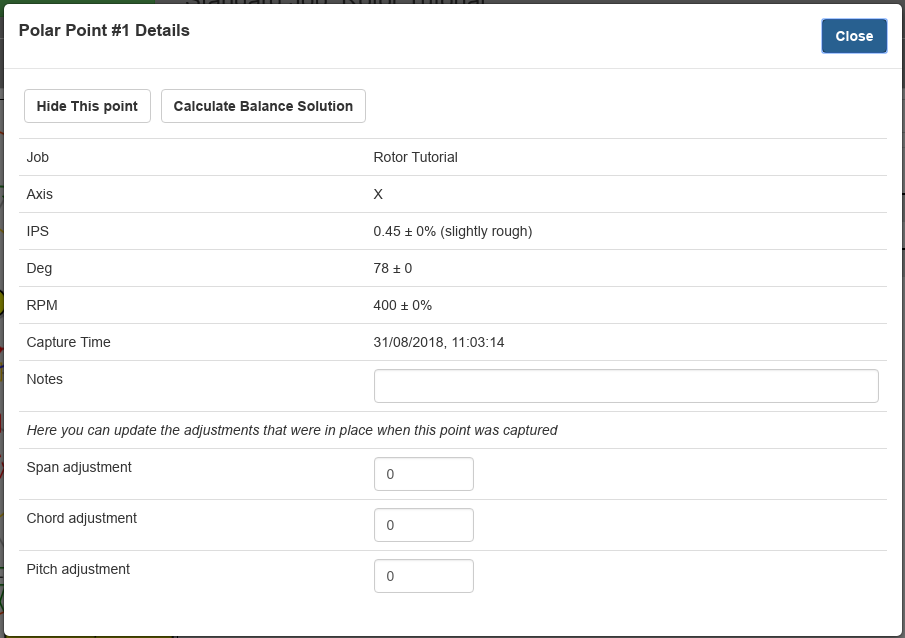
The text input boxes are:
The Notes text input box is used to enter any notes that you wish to record for the point.
Span adjustment, Chord adjustment and Pitch adjustment input boxes may be used to update the adjustment values assigned to this point.
The adjustments should be set before the points are captured by clicking in the Span, Chord or Pitch columns of the polar point list header. If that is done, the adjustment values will be copied into points as they are captured. However, if you forget to enter that information before capturing the points or you need to change the values for some reason then this information can be edited in the point details dialog.
This dialog shows you the changes you have to make to the state of the rotor compared to the state at the time that point was captured.

![[Important]](images/important.svg) | |
The suggested changes are relative values not absolute In words, the dialog in the above figure is saying reduce the weight on the master blade by 1 unit (or, equivalently, add 1 unit to the slave blade), reduce the chord adjustment by 9 units and reduce the pitch adjustment by 1 unit. The dialog also shows the absolute state of the rotor after the suggested changes have been applied. |
The dialog shows how the polar points should move when the changes in the solution have been applied to the rotor. The white points indicate the initial positions and the orange points indicate the final positions. The effect of each adjustment (Span, Chord or Pitch) is shown as an appropriately coloured line.
There are checkboxes provided to select which adjustments and move lines are used when calculating the solution. You must have at least one adjustment and one move line enabled to be able to calculate a solution. Click the Recalculate Solution button to get a new solution after you have altered the selected adjustments or move lines.
The Apply Changes To Current Adjustments button does exactly that, it updates the current adjustments in the polar point list header with the calculated changes. Obviously, you still have to physically make those adjustments to the rotor!
The edit move line dialog is where you define your move lines. It shows a simplified polar chart so you can immediately see the effects of the changes you make. The orientation of the move line is defined by the positions of two nodes which are specified in this dialog along with their adjustment values. Each node has a position (given as Deg and IPS) and a value. The nodes are drawn as filled circles and their values are displayed in a small box.
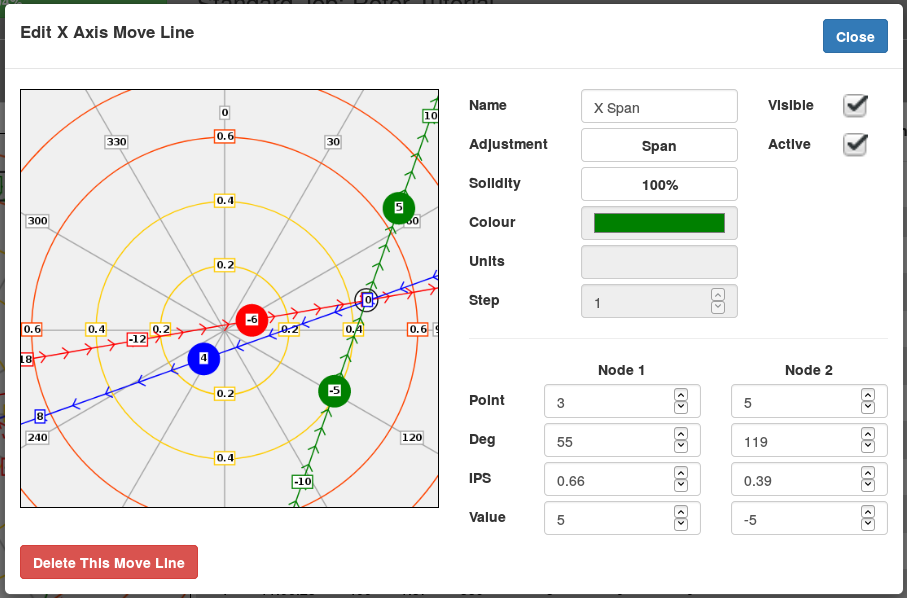
Normally, the move lines (and their nodes) are drawn on top of the polar points. This ensures that the node values are not obscured by any points. Obviously, this can mean that some points are hidden behind the move line nodes and so to make it possible to see those hidden points, while the chart is being panned, the points are drawn on top of the move lines.
On the right hand side of the dialog are various text entry boxes and a couple of checkboxes:
| Name | Enter here the name of the move line (the software doesn't require it to be unique but you will get confused if it isn't!) | |||
| Adjustment | The adjustment this move line is associated with. One of None[a], Span, Chord or Pitch. When a move line is associated with an adjustment, the move line's colour, units and step are inherited from the specified adjustment and cannot be altered in this edit move line dialog. See Section 8, “Changing adjustment settings” for more information on changing adjustment settings. | |||
| Solidity | The percentage solidity of the move line (20, 50, 80 or 100%). | |||
| Colour | The colour used to draw the move line.
| |||
| Units | The units of adjustment for this move line. This is just text, it doesn't feature in any calculations. | |||
| Step | When the solution is calculated, the resulting adjustment will be a multiple of this value. So if you are using washers for the units of adjustment and you only have washers of one size, then a step of 1 would be appropriate but if you also had some washers that weighed half as much, then a step of 0.5 would be appropriate because then the suggested amount of adjustment would be to the nearest 1/2 washer. | |||
| Visible | This needs to be checked to see the move line on the polar chart. | |||
| Active | This needs to be checked for the software to use this move line when calculating the balance solution. | |||
[a] The None adjustment is provided for compatibility with jobs that were created by earlier versions of the PB-4 UI firmware that didn't support adjustments. | ||||
To define a move line, two nodes on the polar chart (Node 1 and Node 2) that the line passes through need to be specified. The nodes are drawn on the chart as coloured blobs that are slightly larger than the points. For each node we can enter the following information:
| Point | If you want the node to be located exactly at the position of a captured point, enter the point's index number here and the following fields (Deg, IPS and Value) will be taken from the chosen point. |
| Deg | The angular position of the move line node. |
| IPS | The magnitude of vibration at the move line node. |
| Value | The adjustment that was in place at the time that the point that defines the position of this node was captured. In Figure 3.9, “Edit move line dialog” above, Node 1 is defined using point 3 and Node 2 is defined using point 5. |
At the bottom of the dialog is the Delete This Move Line button, you will be prompted to confirm the action before the move line is deleted.
The three inbuilt adjustments (span, chord and pitch) are defined with sensible default settings. You may, however, alter these settings if you wish. To do so, click on the appropriate adjustment in the polar point list header and in the dialog that pops up, click Show Adjustment Settings. The dialog expands to show the settings.

The adjustment's settings are:
- Name
Defaults to Span, Chord or Pitch. You can change it as required. The name can be anything so not only can you change it to a preferred language, you can also change it to be a completely different concept. The PB-4 simply uses the adjustment values without any knowledge of what physical changes those adjustments represent.
- Colour
The colour used in the polar point list header row and also for the move lines that are associated with this setting.
What you will get when you click on this depends on the browser you are using. Some browsers will present a colour chooser widget when you click on this. If you're not so lucky it will probably get the chance to enter the colour as a number like #008000 (dark green).
- Comment
This is the text that appears at the top of the dialog. It should remind the user what effect this particular adjustment has.
- Step
The adjustment value is incremented/decremented by this amount when input field arrows are clicked. Also, this sets the granularity of the result. It should be set appropriately considering the nature of the physical adjustment that is to be used. Very small steps will increase the time taken to calculate the result.
- Min Value, Max Value
These optional values specify lower and upper limits for the adjustment. The balance solution will be constrained to not use a value beyond the limits. By default, no constraints are placed on the solution values so it is possible for a solution to be calculated that is not physically possible to implement. For example, it could ask for 3 units of chordwise balance adjustment but the rotor mechanism only provides, say, +/- 2 units of adjustment. In that case, the adjustment value should be limited to +/- 2 and the resulting solution will be constrained to 2. In that situation, the calculated balance solution will not be optimal.
- Units
This optional value is simply a string that specifies the units for the adjustment (gm, mm, °, washers, etc.) The units are not used in any calculation and can be anything.
The spectrum tab displays the vibration spectrum. Vibration level (IPS) is plotted against RPM. The displayed spectrum may either be the live data coming from the PB-4 or a previously captured spectrum. The spectrum is plotted as a curve by joining the tops of the spectral lines[5]. Each spectral line provides the IPS value for a specific RPM (e.g. 100, 200, 300, etc.). The spectrum may be panned and zoomed[6].
The spectrum display is extremely useful for helping to diagnose vibration problems as it allows you to determine how much vibration is occurring at each of the frequencies of interest (prop/rotor frequency, blade pass frequency[7], engine crank and half-crank frequencies, etc.)
Here we see the spectrum tab displaying a previously captured spectrum.
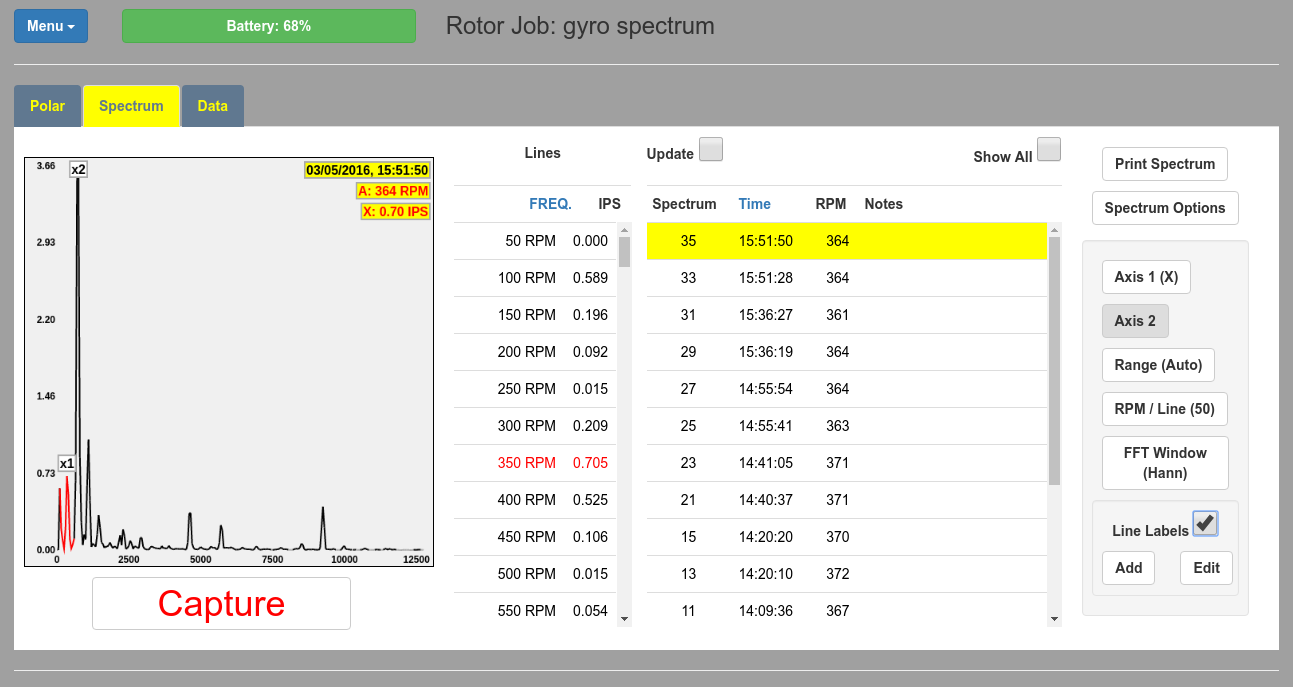
The spectrum tab contains (from left to right, top to bottom):
The spectrum display shows vibration level (in IPS) plotted against RPM. If the PB-4 is connected and the Update checkbox is checked, the display will be continuously updated to show the latest spectrum received from the PB-4. The Axis 1 menu (see below) controls which axis the displayed spectrum is sourced from.
In the top right-hand corner are shown:
Date and time the spectrum was captured.
The tachometer channel used (A or B) and the rotor/propeller RPM (if known).
The accelerometer channel used (X, Y, X2 or Y2) and the vibration level[8] at the rotor/propeller RPM (if that RPM is known).

If the rotor/propeller RPM is known, the region of the spectrum around that RPM is displayed in red and if any line labels have been defined, they will be displayed in a box above their respective lines. Line labels x1 and x2 are shown in the figures.
The bottom 1/3 of the display is the scroll zone. When zoomed into the display, the spectrum may be scrolled left or right by clicking and moving in the scroll zone. On computers with a keyboard and a mouse you can also scroll using shift-mousewheel.
Clicking above the scroll zone displays a cursor line and an info box which contains information about the spectral line below the cursor. The information displayed is the line's vibration level (IPS), frequency (RPM) and ratio of the line's RPM and the propeller/rotor RPM.
Clicking in the middle 1/3 of the display moves the cursor line to the position of the click. Clicking in the top 1/3 of the display moves the cursor one line left or right depending on which side of the cursor you clicked.
To the right of the spectrum display are the Update and Show All checkboxes and the lines and spectra lists.
The Update checkbox controls whether the spectrum display (and spectra list) are automatically updated to show the latest spectrum returned by the PB-4 when it is connected. If not checked, the last displayed data is preserved. So if you want to pause the display, un-check this checkbox.
The Show All checkbox decides whether hidden spectra are listed in the spectra list or not. When checked, all spectra are listed, when un-checked, hidden spectra are not displayed. Also, when this checkbox is checked, the spectrum index number column is highlighted and clicking on a spectrum's index number will toggle its hidden state.
The lines list contains one row for each spectral line in the currently displayed spectrum. Each row displays the frequency of the line and the amount of vibration at that frequency (IPS). Clicking on the FREQ header at the top of the list toggles how the frequency is displayed in the list, RPM or as the ratio of the line's RPM to the rotor/propeller RPM.
If the propeller/rotor RPM is known, the row in the list that corresponds to that RPM is shown in red. Clicking on an entry in the list will move the cursor to that line. If the user interface device screen is very narrow, the lines list is not displayed.
The spectra list contains one row for each spectrum that has been captured. The rows that correspond to axis 1 have a white background and the rows that correspond to axis 2 have a grey background. The spectra are listed in reverse capture order, the most recently captured spectrum being at the top of the list. Clicking on the Time header reverses the order of the list. Clicking on a row will display the selected spectrum. Clicking that row again will display the spectrum details dialog for the selected spectrum where you can enter a note for the spectrum if you wish.
If at the time a given spectrum was captured, the propeller/rotor RPM was known, it will be shown to the right of the spectrum's capture time.
If a note has been entered for a spectrum, it will be displayed in the list. If the spectrum doesn't have a note entered but a point that was captured in the 10 seconds before the spectrum was captured does have a note, then that note will be shown in square brackets [like this!]. The idea here is that you can enter notes for polar points and those notes will then be shown in both the polar point and spectrum lists.
To the right of the spectra list are some buttons:
Clicking this button will create a new page in your browser showing the currently selected spectrum and some textual information. If the currently selected spectrum shows line labels, a list detailing the line labels will be included. You can then print this new window using the normal browser print page facility (e.g. type Ctrl-P).
The Spectrum Options button toggles the display of the spectrum options box (visible above), the options are:
Drop down menus, Axis 1 and Axis 2 let you choose the axes to be included in the spectra list.
The Range button pops ups a menu that lets you choose the display's full scale value. Setting it to Auto will automatically scale the display so that the largest peak almost reaches the top. Setting it to one of the fixed values makes it easier to compare spectra.
The RPM / Line button pops up a menu from which you can select the “width” (in RPM) of each spectral line. The available widths are 10, 20, 50 and 100. The trade off here is overall frequency range displayed versus resolution. Also, the narrower the width of each line, the longer it takes to capture each spectrum. So using 100 RPM per line gives the fastest update rate and the widest range of frequencies displayed with the lowest resolution. Using 10 RPM per line would give the slowest update rate and narrowest range of frequencies displayed but the greatest resolution.
Note that once a spectrum has been captured, the width is fixed. You can't capture a spectrum with one width and later display it with another width.
The FFT Window button pops up a menu from which you can select the type of “FFT window” to use.The available window types are:
- None
No window is used so the display will show artifacts due to the “spectral leakage” that occurs when a periodic waveform is processed by a discrete Fourier transform.
- Hann
The Hann window reduces the spectral leakage and produces a display with fewer artifacts and better frequency resolution. This is the default window type.
- Flat Top
The Flat Top window reduces the spectral leakage and produces the most accurate magnitudes.
Note that once a spectrum has been captured, the window type is fixed. You can't capture a spectrum with one window type and later display it with another window type.
The Line Labels checkbox enables the display of line labels. Line labels are simply short labels that are displayed above the line they refer to. They allow the user to quickly identify the lines of particular interest. The labels are associated with a given spectral line by specifying their “tacho RPM multiplier”. A multiplier value of 1 will position the label above the line that is 1 × the current tacho RPM. A multiplier value of 2 will position the label above the line that is 2 × the current tacho RPM and so on. The multiplier does not have to be an integer value, so values like 2.5 are fine.
It is also possible to display a line label at a fixed RPM rather than at some multiple of the current tacho RPM. To do that, prefix the Tacho RPM Multiplier value with a '=' character. For example, entering
=1500will display the label above the 1500 RPM line irrespective of what the tacho RPM was when the spectrum was captured.The Add button pops up a dialog that lets you input the line label text (ideally just a few characters, no spaces allowed), an optional description and the tacho RPM multiplier (a positive number).
The Edit button pops up a menu of existing line labels so you can choose the one you wish to edit. The edit dialog lets you alter the label, description and tacho RPM multiplier. If the label is cleared or the multiplier is cleared or set to zero, the label is deleted.
[5] The spectral lines are not actually shown in the display.
[6] Pinch-zooming is supported for touch screens and mouse-wheel zooming for laptops, etc.
[7] Blade pass frequency is the prop/rotor frequency × number of blades.
[8] The displayed vibration level originates from the current polar point and may differ from the magnitude of the spectral line(s) that are closest to the actual RPM.
The data tab displays the current vibration data (RPM, IPS, DEG) in a text form. Here we see the data tab displaying data for the X and Y axes.

If the Capture Points and/or Capture Spectra checkboxes are enabled (see below), clicking within the box that surrounds the displayed values will initiate a capture. The box will flash green to indicate that the capture was successful. It will flash red if the PB-4 is not connected or neither of the capture checkboxes are enabled.
The Update checkbox controls whether the data display is automatically updated to show the latest data returned by the PB-4 when it is connected. If not checked, the last displayed data is preserved. So if you want to pause the display, un-check this checkbox.
The Data Options button toggles the display of the data options box (visible above), the options are:
Drop down menus, Axis 1 and Axis 2 let you choose the axes to display.
The Capture Points checkbox enables the capture of points when the data box is clicked. It also controls whether points will be captured when the PB-4's offline capture button is pressed.
The With Waveform Data checkbox enables the capturing of acceleration waveform data when a polar point is captured. The waveform data is not required for the balancing to be carried out.
The Capture Spectrum checkbox enables the capture of spectra when the data box is clicked. It also controls whether spectra will be captured when the PB-4's offline capture button is pressed.
The Enable PB-4 Offline Capture checkbox enables the PB-4's hardware capture button that can be used to initiate a capture when the user interface is not connected.
This checkbox must be checked along with either/both of the Capture Points and Capture Spectra checkboxes for offline capture to occur.
The options page contains large buttons that, when clicked, expand the selected section to show the controls for that option. Most of the options are only available when the user interface is connected to the PB-4.

The section expands to show a list of jobs known to the PB-4, click on one to load it into the browser so it becomes the current job.
The section expands to show 3 controls:
A text input box into which you enter the name of the new job - it must not be the same as an existing job name.
A drop-down list of existing job names - if you select one, the new job will be a copy of the selected job. This provides an easy means to create a new job with a similar configuration to an existing job.
A Create Job button that creates the job and loads it into the browser.
The section expands to show a text input box into which you enter the new name for the current job - it must not be the same as an existing job name. Press enter to action the rename.
The section expands to show 2 sub-sections. The first sub-section contains 3 buttons:
The Delete Job Completely button deletes all the data and configuration information for the current job.
The Delete Only Points button deletes all of the points for the current job.
The Delete Only Spectra button deletes all of the spectra for the current job.
Pressing one of those buttons will ask you to confirm your action. Think twice here because the deleted data cannot be un-deleted. However, the data stored on the PB-4 can be exported (before you delete it, not after!) and subsequently imported again. So it is possible to back up your data to your computer.
The second sub-section contains a selector that lets you choose which jobs you wish to delete and a button to carry out the action which you will be asked to confirm. Once confirmed, all data associated with the selected jobs will be deleted from the PB-4. Be very careful!
| |
Due to limitations in iOS, it is not possible to save/restore data to/from an ipad or iphone unless 3rd party software (e.g. Dropbox) is installed on the UI device. |
The section expands to show controls to save and restore PB-4 data.
A drop-down list of known jobs is provided so you can select the jobs whose data is to be saved. Multiple jobs can be saved at the same time. When the jobs to be saved have been selected, press the Save Selected Jobs To File button.
Pressing the Select PB-4 Archive To Restore button will pop-up a file chooser that lets you select the PB-4 data archive that you wish to load onto the PB-4. Because all job names must be unique, if the archive file contains any jobs with the same name as existing jobs, the name of the new job will have a # character appended.
This section expands to show several sub-sections:
For the PB-4 to be able to access an access point in STA mode, it needs to know the access point's network name (SSID) and password. If the access point supports Wi-Fi Protected Setup (WPS), these credentials can easily be obtained by following the procedure detailed in the PB-4 hardware manual.
If the access point doesn't support WPS or the procedure fails for some reason, you can manually enter the details in here in the two text input boxes labelled Access Point SSID and Access Point Password.
This sub-section contains controls for configuring various aspects of the PB-4 hardware.
Normally, when the exhausted batteries are replaced with a fresh set, the PB-4 detects that they have been changed and resets the battery level to 100%. If it fails to detect the changed batteries, pressing the New Batteries Installed button will reset the battery level to 100%.
The PB-4 supports two tachometer inputs (A and B), clicking the Select Tacho Input button lets you choose which tacho input will supply the tacho signal. Input A corresponds to the 3 pin socket tacho input and input B corresponds to the jack socket tacho input. Unless you have a second tacho connected through the jack socket this should always be set to A.
Clicking the Select Axis To Calibrate button pops up a menu of accelerometer axis names (X, Y, X2 and Y2). Select one of those names to start the accelerometer axis calibration procedure. As the accelerometers are sensitive to gravity, we can use the force of gravity (1 G) to calibrate the accelerometer using the following steps:
Measure the output from the accelerometer with the axis being calibrated pointing straight upwards (+1 G applied).
Invert the accelerometer so that the axis being calibrated is now pointing downwards and measure the output again (-1 G applied).
Subtract the second value from the first and divide by 2 and that gives the accelerometer output for 1 G of acceleration which can be saved as the calibration value.
The user interface takes you through these 3 steps. At each step, a dialog box appears telling you what to do. It's very easy.

Various aspects of the PB-4's behaviour can be configured via a set of configuration values.
To read the current value, enter the value's name in the Name text input box followed by the enter or accept key and the value will be fetched from the PB-4 and stored in the Value text input box.
To set a value, enter it's name in the Name text input box and the new value in the Value text input box.
See Appendix A, PB-4 Configuration Values for a list of configuration value names and their default values.
| |
Due to limitations in iOS, it is not possible to load firmware files from an ipad or iphone unless 3rd party software (e.g. Dropbox) is installed on the UI device. |
This section expands to show two buttons:
Pressing the Select PB-4 CPU Firmware File To Upload pops up a file chooser that lets you select the file containing the new PB-4 CPU firmware you wish to install. Select the required file and the contents will be uploaded to the PB-4 and installed.
Pressing the Select PB-4 Wi-FI Firmware File To Upload pops up a file chooser that lets you select the file containing the new PB-4 Wi-Fi firmware you wish to install. Select the required file and the contents will be uploaded to the PB-4 and installed.
Please see the PB-4 hardware manual for more information regarding the uploading of firmware.
| |
Due to limitations in iOS, it is not possible to load user interface files from an ipad or iphone unless 3rd party software (e.g. Dropbox) is installed on the UI device. |
The section expands to show two buttons and a checkbox:
Pressing the Select PB-4 UI Zip File To Upload pops up a file chooser that lets you select the zip file containing the new PB-4 UI files you wish to install. Select the required file and the contents will be uploaded to the PB-4 and installed.
Pressing the Select File To Upload button pops up a file chooser that lets you select a single file to be uploaded and stored on the PB-4 web server. Once uploaded, the file will be accessible through your browser.
You can use this facility to update individual files such as this manual. For example, you may download the latest version of pb4_ui_manual.pdf from the Smart Avionics website and then use this button to install it onto the PB-4.
The Enable UI File Caching checkbox enables the caching of the UI files in the browser's local storage. By storing those files locally in the browser, it greatly speeds up the loading of the UI web page.
This section expands to show a text input box into which you can enter the IP address (network address) that will be used to connect the browser to the PB-4 when you click on the connect button. You do not normally need to do this because the browser knows the PB-4's IP address because that's where the user interface web files (HTML, etc.) you are currently viewing were loaded from. The only time you would enter an IP address here is when you are loading the user interface web pages from a different server than the PB-4.
Propeller mass imbalance can be a major source of vibration. However, there are other sources of vibration as well. To minimise the overall vibration level and to make the dynamic balancing process more effective, all other sources of vibration must be minimised before dynamic balancing is carried out.
| |
Unless the engine is running smoothly, there is little point in trying to balance the propeller. Carburettor imbalance, dirty plugs, loose engine mounts and general wear and tear are just some of the reasons why the engine could be producing excess vibration. |
Propellers with an adjustable blade pitch will produce a lot of vibration if all the blades are not set to the same pitch. This is critical: if a blade's pitch differs from its neighbours' by even a fraction of a degree, it will produce vibration that appears to be caused by mass imbalance but cannot actually be removed by mass balancing.
| |
Before attempting to dynamically balance a variable pitch propeller (either ground adjustable or in-flight adjustable), confirm that the blades' pitch are equal to within the tolerance specified by the propeller's manufacturer (typically, 0.25°). |
When an object rotates around an axis, if the mass of the object is not uniformly distributed around that axis, a force (the centripetal force) will be generated and will cause vibration. As the magnitude of the force is proportional to the square of the rotational velocity, at high RPMs (high rotational velocity) even a small mass imbalance in a propeller will generate an appreciable amount of force (and hence vibration). This vibration can be measured by mounting a sensor on the engine as close to the propeller as possible. Conventionally, the magnitude of a propeller's vibration is reported as a peak velocity in units of Inches Per Second (IPS).
A propeller can be statically balanced in the workshop using a static balancing tool. This often involves suspending the propeller from its central axis. If the propeller is statically balanced, the blades should be level[9]. If one blade is heavier than the others (or its centre of mass is further from the centre of the propeller), it will dip towards the floor. If this occurs, weight can be added to the hub on the opposite side of the central axis to the dipping blade to bring the propeller level.
All propellers should be manufactured with blades that have equal mass (and mass distribution) and so a new propeller should not require static balancing. Propellers that have suffered damage to the blades (stone chips or tip abrasion) may well benefit from being statically balanced.
While statically balancing a propeller is worthwhile, the best results will be obtained if the propeller is dynamically balanced together with the spinner.
Dynamic propeller balancing involves measuring the actual rotational vibration generated at a realistic propeller RPM and then adding weights to the propeller hub or spinner backplate to minimise the measured vibration level. Because the balancing operation is carried out with the propeller and spinner attached to the engine, the best possible solution is obtained.
The vibration is measured using a sensor known as an accelerometer. The accelerometer is securely attached to the engine as close to the propeller as possible and it measures the acceleration of the front of the engine in one direction (normal to the propeller shaft). If the propeller is out of balance, as the centre of mass rotates around the axis of rotation, the resulting centripetal force tries to pull the propeller (along with the spinner and engine) towards the centre of mass. This rotating imbalance force acts on the mass of the engine/propeller combination and accelerates it. It is this acceleration that is measured by the accelerometer.

If the accelerometer was very selective and measured only the vibration caused by the rotating out-of-balance propeller, the signal it produced for one rotation of the propeller would look like a sine wave as shown here. In reality, the measured acceleration waveform is much more complex than a simple sine wave. This is mainly because of the vibration generated by the engine and also the turbulence generated by the rotating propeller blades. The dynamics of the engine mountings also affect the waveform.
The balancer's processing unit digitises the measured acceleration waveform and uses the resulting numbers to calculate the magnitude of the vibration signal. This magnitude is reported as a peak velocity in units of Inches Per Second (IPS).
The accelerometer senses the magnitude of the vibration but more information is required to carry out the balancing process. This is because it is not sufficient to know just the magnitude of the vibration signal. It is also necessary to know the phase of that signal. The phase of the signal is the relationship of the signal waveform to the angular position of the propeller. Given the phase information, it is possible to determine where the weight is required to be added to reduce the vibration. By detecting when one particular propeller blade passes an optical sensor, the balancer can measure and report the phase of the vibration waveform. The optical sensor also works as a tachometer to measure the propeller RPM.
![[Warning]](images/warning.svg) | |
Propellers can kill. Make sure that the engine ignition is switched off before touching the propeller. Always assume that the engine could fire when the propeller is being moved. Make sure that the aircraft is securely chocked or tied down while carrying out the balancing process. |
Please see the PB-4 Hardware Manual for a description of the PB-4 sensors and how they are attached to the aircraft.
For maximum accuracy, the dynamic balancing process should only be carried out in light winds. Ideally, the wind should be less than 5 kts. The aircraft should be positioned so that it is pointing into any wind.
| |
Before you start the engine, check that the Polar Options are all set appropriately. Propeller mode should be selected and the point smoothing, number of weight sites and PSRU ratio set to suitable values. |
Make sure the engine is thoroughly warm before taking any readings.
Firstly, you need to decide what propeller RPM you are going to use while balancing. For a typical propeller, an RPM in the range 1500-2000 is often a good choice. Using the polar tab, observe the movement of the current polar point. If you think it is necessary, adjust the throttle to find the RPM that minimises the variation in the current point's position. When you adjust the throttle it will take a few seconds for the point to settle down enough to allow you to capture a reading.
| |
Once you have determined the best RPM to use, it is important to use the same RPM for each balancing run so that you get consistent results. |
With a steady RPM being reported by the balancer, press the Capture button to capture a polar point. The point's data will be entered into the list of polar points for the current job.
Capture a few points – if the propeller is obviously out of balance, the points will be clustered together some distance away from the centre of the chart.
Now stop the engine and double-check that the ignition is switched off.
If the vibration level is already 0.15 IPS or less, the propeller can be considered reasonably well balanced – in ideal conditions, the balancer is capable of balancing a propeller down to about 0.03 IPS so you may wish to continue the process to achieve a better result. If you want to improve the balance, you must carry out the balancing procedure as described in the next section.
![[Tip]](images/tip.svg) | |
To reduce battery drain in the PB-4 and the tablet, it is best to disconnect the user interface from the PB-4 when you are not actually capturing points or viewing the live data. When you are ready to capture a new point, just reconnect. |
| |
Weight sites are numbered from 1 to the number of sites. Considering the direction of normal propeller rotation, site 1 will pass a fixed point (e.g. the tacho) before site number 2, and so on. |
The position and the mass of the required balance weight(s) is determined as follows:
With no balance weights attached to the propeller[10], capture one or more points. Choose one of those points to be the start point by displaying the point details dialog (click on the point's entry in the point list to highlight it and then click again to open the dialog). Click on the Use As Start Point button and close that dialog.
Now attach a trial weight. The angular position of the weight is not important at this stage so we just attach it at site 1. For a typical composite propeller, a few AN970 washers would be a reasonable initial trial weight. So, having checked the ignition is switched off, securely attach the trial weight using an approved method and enter the amount of weight and the site number (1) in the Set Weight Amount And Positions dialog that pops up when you click on WT1 or WT2 in the polar point list header. The amount value can be specified in any units (grams, ounces, washers, etc.) To begin with, you only have weight attached at a single location (the trial weight) so in one row enter the amount (e.g. 3 for 3 washers) and the location (e.g. 1). An amount of zero means that no weight was attached.
With the trial weight in place, capture a few more points. If the propeller is still well out of balance, all of the points should be located close together on the chart. If the propeller is only slightly out of balance or there is an appreciable amount of vibration from other sources, the locations will tend to differ.
To improve the balance, select one of the latest points and display its details. At the bottom of the dialog are suggested adjustments to the weights' amounts and positions. Carry out those changes and press the Set Configuration To This Solution button to update the current weight configuration to the suggested values. If you did not follow the suggested changes exactly you will need to manually enter the new weight configuration by exiting the point details dialog and then opening the Set Weight Amounts And Positions dialog (click WT1 or WT2). Now capture some more points to see what difference that change has made.
Depending on the quality of the captured points and how closely you follow the instructions, you may well have to repeat this step a few times to get the best result.
The PB-4 does not actually say that the propeller is balanced or not; it's left up to the operator to decide when to stop the process based on the IPS reduction achieved.
When the balancing has been completed, double-check that all balance weights are securely attached. If you have been using temporary weights to carry out the balancing, they should be replaced with permanent weights whose mass and position are such that they have the same effect as the temporary weights. If in doubt, recheck the balance once the permanent weights are installed.
Remove the sensors and the tape from the propeller blade. Make an entry in the appropriate log book to record the vibration level achieved and the RPM used.
This section provides answers to common problems that can arise when balancing.
The RPM could be unsteady for the following reasons (most likely first):
The optical sensor is not pointing at the reflective tape or the tape is not parallel with the sensor's block. It may help to add one or more further strips of reflective tape to increase the width of the reflective area.
The optical sensor is either too close or too far away from the propeller.
The angle of incidence of the light beam on the propeller blade is outside the acceptable range.
The sensor is being confused by extra reflections from shiny propeller blades. Rotate the sensor to increase the angle of incidence of the light beam on the propeller blade. You can also try adding non-reflective tape to the other blades in the same position as the reflective tape.
The engine RPM really is changing!
This indicates that the vibration waveform is not consistent from one propeller revolution to the next. This implies that some (perhaps most) of the measured vibration is out of phase with the propeller. Any of the following problems will cause the position of the polar point to vary:
The engine is not running smoothly or the engine mounts are in poor condition.
The RPM is not being reliably detected. Unless the RPM is correct, the IPS and DEG and their associated standard deviations are meaningless.
The wind is gusting. At low vibration levels, just a few knots of wind can make it appreciably harder to obtain reliable data.
You are using an RPM that is triggering an airframe resonance.
The accelerometer is not securely mounted or the sensing axis is not pointing at the propeller's axis of rotation or the sensing axis is parallel with the direction of movement of the engine's pistons.
You are using the wrong accelerometer axis.
The spinner is wobbling.
The engine cowling is not fitted to minimise the effects of turbulence.
If the balancer shows a significant level of vibration with a small standard deviation and adding weight doesn't appear to reduce the level or substantially change the angle, any of the following could be true:
The amount of weight being added is too small to have an effect. The heavier the propeller/spinner, the more weight has to be added to reduce a given level of vibration.
The propeller is suffering from pitch imbalance (the blades don't have equal pitch). Pitch imbalance has to be corrected before the propeller can be dynamically balanced.
The weight is not being added at the correct position.
You are using the wrong accelerometer axis.
This chapter aims to provide an overview of the rotor balancing process. Although the emphasis is on gyroplane rotor balancing, it is also largely applicable to helicopter rotors. Please see the PB-4 Hardware Manual for details of how the sensors are attached to the aircraft and Section 3.4, “Polar Options button” for details of selecting the profile that matches the orientation of the accelerometer axes.
A tutorial document that provides an in-depth description of how to use the PB-4 to balance a rotor is available from the Smart Avionics website.
Mass imbalance is one of the causes of rotor vibration and the PB-4 system can help you balance the rotor to eliminate that vibration. Other vibrations may also be present. In particular, gyroplanes often suffer strong vibration at twice the rotor frequency. This “× 2” (times 2) vibration is often much larger than the vibration due to imbalance and so even when the rotor has been mass balanced satisfactorily, vibration will still be noticeable to the occupants.
The above spectrum is from a gyroplane rotor that shows the very large × 2 vibration still present after the rotor was balanced. You can see that the vibration at the rotor RPM (372) was only 0.08 IPS but the × 2 vibration at 750 RPM was 4.23 IPS, that's around 50 times larger!
Unlike, rotor mass imbalance, the × 2 vibration cannot be suppressed by simply adding weights. It is fundamental to the geometry of a (2 bladed) rotor system and the physical properties of its components (blades, hub, mast, etc.) The × 2 vibration can be caused by a variety of reasons. Some possibilities are:
The rotor “teeter height” is wrong.
When the blades are perpendicular to the direction of flight more drag is produced.
Furthermore, the amount of × 2 vibration being produced is influenced by the flight conditions (rotor speed, airspeed, etc.) At this time, the PB-4 system can only report the magnitude of the × 2 vibration and it does not offer any suggestions as to how the level of vibration can be reduced. Perhaps in the future when the causes of the × 2 vibration are better understood, it will be able to make helpful suggestions.
Gyroplane rotors are balanced by making these adjustments:

What you need to know to balance the rotor is how much change (magnitude and sense) is required for each of these adjustments. You can determine that information using a polar chart that has been augmented with move lines. A move line is literally a line drawn on a polar chart that shows the direction a polar point would move when a particular adjustment is made to the rotor. A move line is required for each adjustment you are going to alter. Each accelerometer axis (X and Y) requires its own set of move lines.
| |
Before you start capturing any data, please ensure that the current job has the correct polar options. Rotor mode should be selected and you should also choose the profile that matches the accelerometer orientation. It is strongly recommended that you use the PB-4's offline capture button to capture the data while flying as this obviates the need to interact with the tablet while flying, it doesn't even need the tablet to be in the aircraft. If you want to use it, check that it has been enabled in the data tab options. If you do wish to use the tablet to capture the points, consider using the data tab as that just requires you to click on the data display box so it's easier to do while flying. Check that it has been set up to capture points (and optionally, spectra). Also, if the machine has an open cockpit, take precautions to avoid the tablet disappearing aft through the propeller! If possible, attach it firmly to a knee pad or to the aircraft structure. |
Before the move lines can be created, you will need to measure the vibration (capture polar points) for two different values of each adjustment. For example, to define the spanwise move line you need to add weight to one of the rotor blade tips, enter the adjustment value as described in Section 2, “Points list” and capture a few polar points. You then move the weight to the other rotor blade tip, enter the new adjustment value and capture a few more points. Finally, remove the weight again (to return the rotor to the original condition).
The process should be repeated to gather the data required to define the chordwise move line. This time the adjustments would involve shifting the rotor mass on the teeter pivot. Lastly, you could gather the data required to define the pitch move line (if required).
| |
To ensure that the move lines are good, follow this advice:
|
Once you have captured the polar points for the adjustments you are using, you can create the move lines. To create a move line, follow these steps:
Look at the polar points that were captured for the adjustment you are interested in, i.e. spanwise balance, and decide which couple of points you want to use to define the direction of the move line. Note their numbers.
Click on Add Move LIne and choose the move line you wish to add, e.g. X Span. The edit move line dialog will appear.
Enter the numbers of the points you have chosen to define the move line into the Point fields for Node 1 and Node 2. When you do that the Deg, Ips and Value fields will automatically be copied across from the selected points. That's it, close the dialog.
You will need to create a move line for each axis (X and Y) and each adjustment (span, chord and, possibly, pitch). So you should end up with 4 (or 6) move lines.
| |
Move lines are only valid for a given flight condition (airspeed, AUW, rotor RPM, trim position, etc.) and sensor configuration. If you move the sensors or, say, invert an accelerometer axis, the move lines will no longer valid. |
With the move lines defined, select a polar point that was captured with no adjustments applied (i.e. one of the initial polar points) and open the points details dialog. Click the Calculate Balance Solution button and in a few seconds the solution will be displayed in the rotor balance solution dialog. Apply the suggested changes to the rotor and press the Apply Changes To Current Adjustments button to keep the PB-4 informed of those changes. Capture a few more points to see how good the result is. If you feel the balance could still be better, repeat the process by selecting one of the latest points and calculate a new solution.
This manual has so far described how propellers and rotors can be balanced by measuring the vibration in a single plane (I'm referring to the abstract geometric surface, not the aircraft!) The accelerometer has been mounted as close as possible to the hub of the propeller/rotor and orientated such that it is sensing the vibration in the propeller/rotor's plane of rotation.
Single plane balancing generally works well when the diameter of the object being balanced is much greater than its depth and also when it is attached to the supporting shaft at exactly 90°. Aircraft propellers and gyroplane/helicopter rotors typically satisfy those conditions and so can be balanced satisfactorily using the single plane method. When the depth of the object being balanced is increased relative to its diameter or if it "wobbles" on the supporting shaft, two plane balancing is required. This chapter describes how the PB-4 can be used to carry out two plane balancing using the two plane balancing dialog which is accessible through the main menu.
The two plane balancing method is really very similar to the single plane balancing method. It involves measuring the vibration when no trial mass is attached, measuring the vibration with trial mass attached and then calculating a solution from those measurements. The difference is that the trial mass is attached twice, once in each plane, and for each position of the trial mass (not present, attached in plane 1 and attached in plane 2), vibration readings are captured from both planes. So that means that 6 IPS/DEG values are required to be able to calculate the two plane balance solutions that are needed.
The planes in which the accelerometer(s) are mounted are called measurement planes. The planes in which the trial masses and the final correction masses are attached are called the correction planes. Typically, accelerometers are mounted as close as possible to the bearings that support the object being balanced.
Generally speaking, the object being balanced is either supported by bearings at each end so that its mass is (mostly) between the bearings or it has significant mass that overhangs one bearing. For items that are supported at both ends, the measurement and correction planes may be close together as is shown in the next figure.

For overhung items, the configuration is as shown in the next figure. Note how the #1 measurement plane is close to the #1 correction plane but the #2 measurement plane is far from the #2 correction plane.

The two plane balancing dialog provides 6 input fields into which the polar point list row numbers for the 6 points required for the calculation are entered. Assuming the required polar points have been captured, simply enter the points' row numbers into the appropriate input fields and the Deg and IPS values will be automatically filled out. Once the row numbers have been entered, the resulting solutions are shown below the table in the same format (ANGLE × SCALE) as shown on the propeller mode polar chart. There are two solutions, one for each correction plane.
Here is the two plane balancing dialog that has all 6 point row numbers entered into it and is therefore displaying solutions.
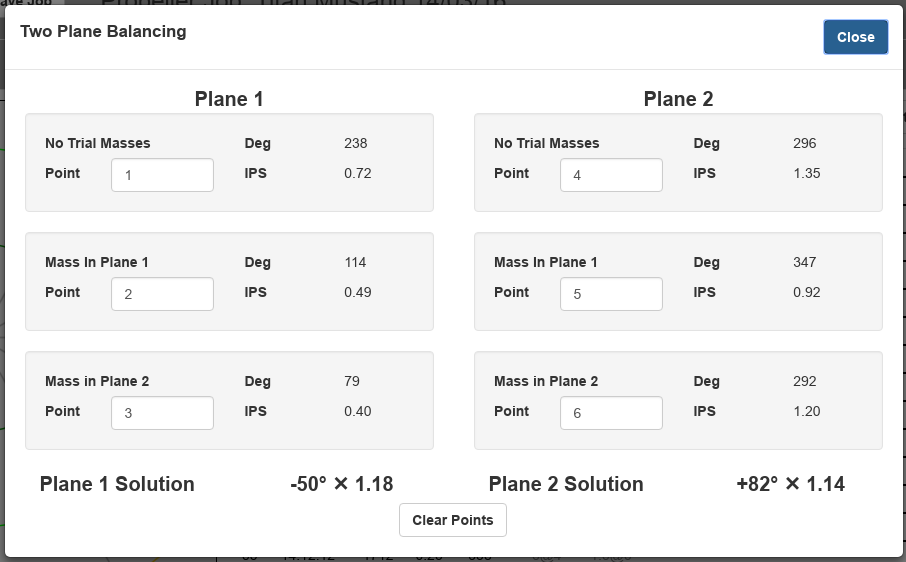
The plane 1 solution is -50° × 1.18 which says attach a mass that is 1.18 times the trial mass in a position that is 50° backwards (against the direction of rotation) from the position where the plane 1 trial mass was attached.
The plane 2 solution is +82° × 1.14 which says attach a mass that is 1.14 times the trial mass in a position which is 82° forwards (in the direction of rotation) from the position where the plane 2 trial mass was attached.
Use the browser back button (or ESC key) when you want to leave the two plane balancing dialog. The data values entered are persistent so you can leave the dialog and return to it and the values will still be there. A button is provided to clear all of the points which is a good idea when starting a new calculation.
Two plane balancing may be carried out using either a single accelerometer or dual accelerometers. When using a single accelerometer, 6 runs are required to capture all the points needed. When using dual accelerometers, only 3 runs are required as points for both planes are captured at the same time.
The two plane balancing procedure when using a single accelerometer is as follows:
Mount the accelerometer so that it is sensing vibration in measurement plane 1.
With no trial mass attached in either correction plane, capture a couple of points
Attach a trial mass so that it is in correction plane 1 and capture a couple of points, mark the position of the mass and remove it.
Now attach the same mass so that it is in correction plane 2 and capture a couple more points. Mark the position of the mass and remove it. You now have data for the 3 points on the left hand side of the dialog.
Move the accelerometer so that it is now sensing vibration in measurement plane 2.
As above, capture 3 further sets of readings for the no-mass, mass in correction plane 1 and mass in correction plane 2 configurations to provide the data for the 3 points on the right hand side of the dialog. It is important that when you attach the trial mass you use the same positions as you did previously. It is also important that all of the points have the same RPM.
Enter all 6 points into the two plane balancing dialog and you will get two solutions, one for the mass in each correction plane.
The procedure when using dual accelerometers is as follows:
Mount the two accelerometers such that one is sensing the vibration in measurement plane 1 and the other is sensing the vibration in measurement plane 2. Select Rotor Mode and set the axis selectors to the two accelerometer channels you are using (i.e. X and X2). Set the profile to None. The points list and polar chart will now display the points from both accelerometers.
With no trial mass attached in either plane, capture a couple of points. The PB-4 will capture points from each accelerometer at the same time.
Attach a trial mass so that it is in correction plane 1 and capture a couple of points. Mark the position of the mass and remove it.
Now attach the same mass so that it is in correction plane 2 and capture a couple of points. Mark the position of the mass and remove it. You now have all 6 points required. Take care to select the correct points when entering the data into the view.
Here are the names and default values for the PB-4 configuration values, they control the behaviour of the PB-4. Unless advised to by Smart Avionics, do not alter any of these values.
| Name | Default Value | Notes |
|---|---|---|
| accel-adc-counts-per-g-0 | 382 | |
| accel-adc-counts-per-g-1 | 382 | |
| accel-adc-counts-per-g-2 | 382 | |
| accel-adc-counts-per-g-3 | 382 | |
| balancer-cycles | 255 | |
| balancer-min-cycles | 4 | |
| balancer-max-points-to-average | 15 | |
| balancer-polar-mode | 0 | |
| fft-window-type | 1 | Hann |
| fft-rpm-per-line | 50 | |
| idle-timeout | 30 | seconds |
| mcu-flash-crc | ||
| tacho-channel | 0 | |
| battery-mah | 1900 | |
| capture-points-file | ||
| capture-spectra-file | ||
| capture-button-mask | ||
| wifi-chan | 1 | |
| wifi-ap-ssid | ||
| wifi-ap-password | ||
| wifi-enable-mdns | 1 | |
| wifi-last-sta-ip-addr | ||
| wifi-mac-addr | ||
| wifi-fw-version | ||
| wifi-ssid | ||
| wifi-udp-broadcast-period | 1000 | mS |
| wifi-udp-broadcast-port | 55555 |
The PB-4 user interface has been designed to provide good functionality without being overly complicated. Some aspects of the UI are configurable via the UI configuration dialog. Click on the UI version number in the bottom right corner to open the UI configuration dialog.

At the top of the dialog are some buttons: File, Cancel and Save.
The File button pops up a menu containing these items:
- Export Configuration
Prompts the user for the name of a file to save the UI configuration data into (JSON format). All configuration data (including profiles) will be stored in the file.
- Import Configuration Or Profile
Prompts the user for a file containing either a UI configuration or a single profile. Configuration data will replace the current configuration. Profile data will replace an existing profile with the same name or create a new profile if the name is unknown.
- Reset To Defaults
All configuration values are reset to their default values. User-defined profiles are not modified or deleted.
The Cancel button closes the dialog and discards any changes you have made.
The Save button closes the dialog and saves any changes you have made.
Below the top row of buttons, the configuration values are grouped into sections which can be expanded by clicking on the large buttons. The first section contains the rotor profiles.
Clicking on a rotor profile name expands the section to show the profile values. If the profile is predefined (but not None or Standard), the values can be edited and there will be buttons to reset the values back to their defaults. There are also buttons to export the profile (as a JSON file that can be imported into another PB-4) and delete the profile. If you wish to create a new profile, enter its name into the box at the top of the profiles section and hit enter. The new profile will be created and you can edit its values.
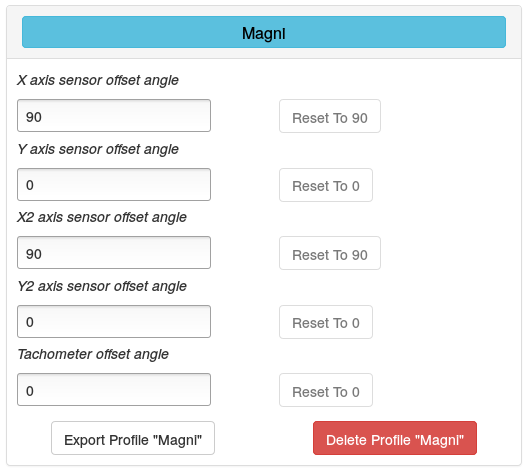
The following sections contain various values that affect the display of the polar chart, spectrum, waveform, etc. Please open up the dialog and have a browse through the values to see what can be configured. If you change something and later decide you want the original value back, just use the individual reset button.
Remember that changes to most of these values will not take affect until the UI configuration has been saved and the PB-4 web page is reloaded.
A
- about dialog, Menu button
- accelerometer, Dynamic propeller balancing
- calibration, Accelerometer axis calibration
- access point
- set details, Set access point details
- add move line
- button, Polar Options button
- adjustment
- dialog, Points list
- specifying, Point details dialog
- axis
B
- balancing
- procedure, Balancing procedure
- batteries
- low warning, Connect button
- new, Set the battery level to 100%
- Best
- points, Points list, Points list
- blade pass frequency, Spectrum Tab
C
- calculate
- solution, Point details dialog
- capture
- button, Capture button, Capture button, Capture button
- polar point, Taking a vibration reading
- capture points
- checkbox, Data Options button
- capture spectrum
- checkbox, Data Options button
- centripetal force, Propeller mass imbalance, Dynamic propeller balancing
- configuration values
- accessing, Get / set configuration values
- connect
- button, Connect button
- correction planes, Measurement and correction planes
- current point, Polar chart, Polar chart
D
- data options, Data Options button
- data tab, Data Tab
- delete
- multiple jobs, Delete jobs
E
- edit move line
- button, Polar Options button
- dialog, Edit move line dialog
- enable PB-4 offline capture
- checkbox, Data Options button
F
- FFT
- window, Spectrum Options button
- firmware
- upload, Firmware upload
- fullscreen mode, Menu button
H
- help page, Menu button
I
- Inches Per Second, Propeller mass imbalance
- IP address
- set, Set PB-4 IP address
J
- job, Jobs
- change to another, Change to another job
- create new, Create a new job
- default, Jobs
- delete, Delete jobs
- delete multiple, Delete jobs
- rename, Rename the current job
L
- line label, Spectrum display, Spectrum Options button
- lines list, Lines and spectra lists
- load move lines
- button, Polar Options button
- log book, After balancing
M
- measurement planes, Measurement and correction planes
- menu
- button, Menu button
- move line, Polar chart, Rotor adjustments
- move lines
- show, Polar Options button
N
O
- options page, Options Page
P
- peak velocity, Propeller mass imbalance
- phase, Dynamic propeller balancing
- point
- best, Points list, Points list
- current, Polar chart, Polar chart
- define start point, Point details dialog
- details dialog, Point details dialog, Point details dialog
- group, Points list, Points list
- hiding, Point details dialog, Point details dialog
- smoothing, Polar Options button, Polar Options button
- points
- list, Points list, Points list
- points visibility, Points list, Points list
- polar
- mode, Polar Options button, Polar Options button
- options, Polar Options button
- polar chart, Polar chart, Polar chart
- polar options
- button, Polar Options button
- polar tab, Polar Tab - Propeller Balancing, Polar Tab - Rotor Balancing
- polar chart, Print Polar Chart menu, Print Polar Chart menu
- spectrum, Print Spectrum button
- profile
- button, Polar Options button
- edit, Editing rotor profiles
- propeller
- dynamic balancing, Dynamic propeller balancing
- mass imbalance, Propeller mass imbalance
- pitch imbalance, Minimising other sources of vibration, Adding weight does not reduce the vibration level
- static balancing, Static propeller balancing
- PSRU ratio, Polar Options button
R
- range
- spectrum display, Spectrum Options button
- responsive
- user interface, Initial screen
- rotor balance
- calculate solution, Point details dialog
- recalculate solution, Rotor balance solution dialog
- rotor profile, Editing rotor profiles
- RPM
- choice, Taking a vibration reading
- erratic, The displayed RPM is erratic or wrong
- per spectral line, Spectrum Options button
S
- save/restore data, Save / restore PB-4 data
- sensorOffsets, Rotor mode profiles
- show all
- checkbox, Lines and spectra lists
- show matching spectrum, Point details dialog, Point details dialog
- show move lines
- checkbox, Polar Options button
- show waveform, Point details dialog, Point details dialog
- button, Show Waveform button, Show Waveform button
- solution, Polar chart
- spectrum
- show matching, Point details dialog, Point details dialog
- spectrum display, Spectrum display
- spectrum tab, Spectrum Tab
- spider, Polar chart weight site spider
- start point, Point details dialog
- choose, Balancing procedure
T
- tacho input
- selecting, Selecting the tachometer input
- tachometer, Dynamic propeller balancing
- tachoOffset, Rotor mode profiles
- tracking, Rotor adjustments
- trial weight, Balancing procedure
- two plane balancing, Two Plane Balancing
- two plane balancing dialog, Two plane balancing dialog
U
- UI configuration dialog, User Interface Configuration
- UI files
- upload, Upload UI files
- update
- checkbox, Points list, Points list, Lines and spectra lists, Data Tab
V
- vibration
W
- waveform
- weight
- specifying, Points list, Point details dialog
- weight sites
- number of, Polar Options button
- what next
- button, What Next? button, What Next? button
- Wi-Fi
- wind, The current polar point position varies widely
- with waveform data
- checkbox, Data Options button